
There are many different types of trading strategies to employ with forex. In fact, the best approach is one which includes a customized trading strategy, often in tandem with other forex trading strategies for maximum effectiveness. A good point of departure for anyone wanting to trade forex is an understanding of your risk preference.
As a rule, forex trading is not advised for risk-averse traders, given the extremely volatile nature of global currency markets. Having said that, currency trading can present many lucrative opportunities to individuals, on the proviso that careful and methodical research is conducted, and effective budgeting is in place.
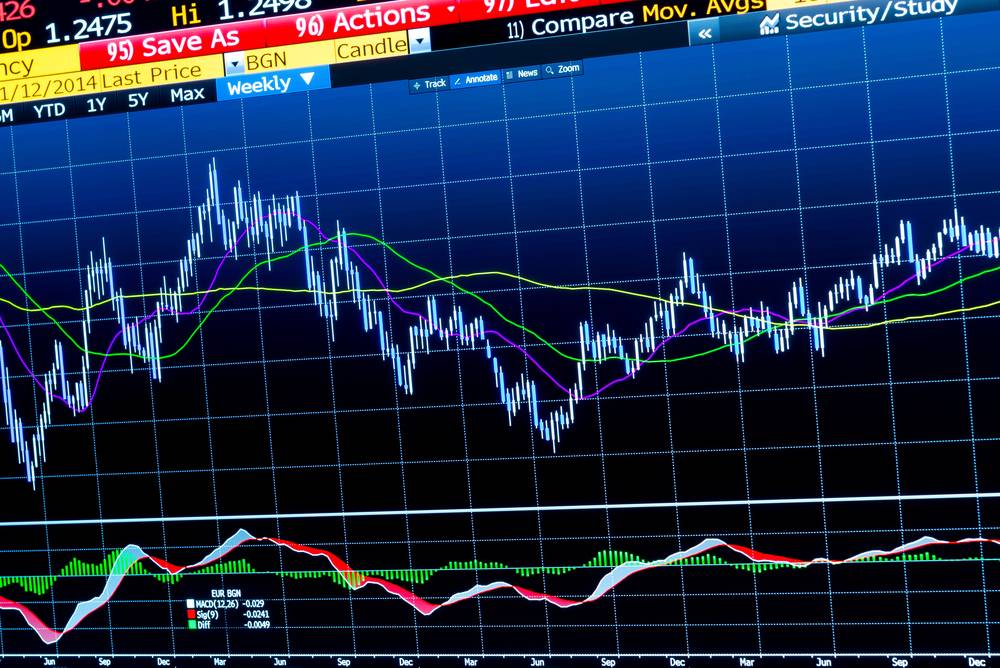
Quick intro to technical analysis
Most every trading guide on forex begins with an introductory lesson on technical analysis and fundamental analysis. Technical analysis describes the use charts, graphs, and trends to make decisions related to forex trading strategies. Since nobody can forecast the future, past data is used. In forex trading, there is no guarantee that past patterns will repeat themselves, particularly over the short-term, given the volatility of pricing in this market.
However, many traders rely on technical analysis during their decision-making processes. If the GBP/USD pair tends to reflect bullish activity, trends would support a continuance of such activity. Traders use technical analysis to forecast whether a currency is overbought (subject to sell-off), or oversold (subject to purchase). This moves the currency needle accordingly.

Claim up to $26,000 per W2 Employee
- Billions of dollars in funding available
- Funds are available to U.S. Businesses NOW
- This is not a loan. These tax credits do not need to be repaid
Quick intro to fundamental analysis
With fundamental analysis, traders are looking at macroeconomic variables, not specific charts and graphs to determine whether a currency like the USD, GBP, EUR, or ZAR will appreciate or depreciate. With fundamental analysis, traders will be looking at the big picture with things like interest rates, inflation rates, unemployment rates, non-farm payroll data, and the like. Of course, many other elements have to be considered as part of fundamental analysis, including geopolitical events such as tensions between countries, natural disasters, elections and so forth.
Each event has the potential to shift currency values. Most of the time, traders will price the impact of a macroeconomic variable into the equation ahead of time. When the actual news release is announced, this has very little impact on trading activity. However, if the expected result and the actual results differ, then the macroeconomic variables will have an outsized impact on trading activity.
Trading in Action: SMAs, EMAs, Bollinger Bands for the GBP/USD Pair
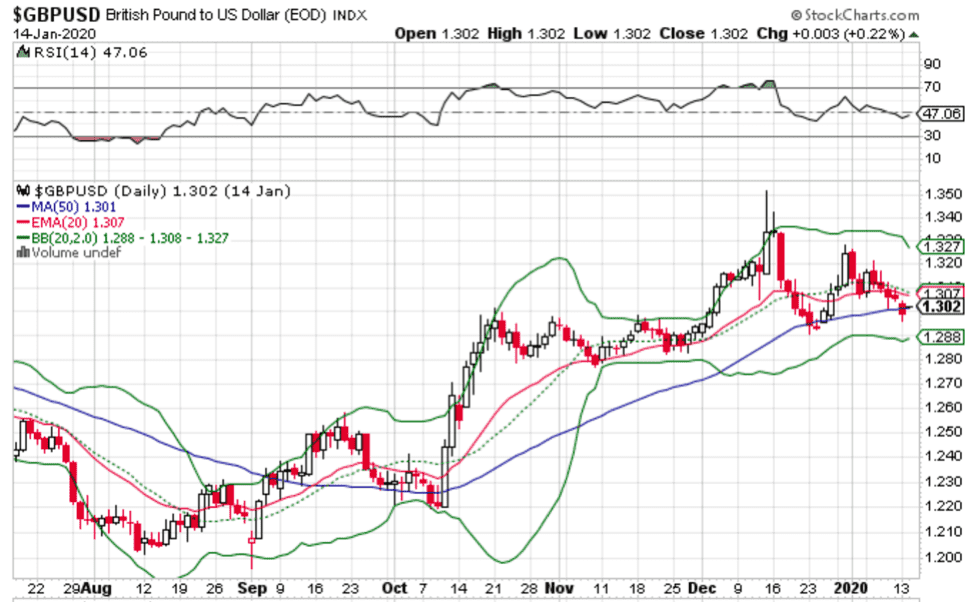 Source: StockCharts GBPUSD Pair with Overlays
The GBP/USD currency pair is a major currency pair. It is one of the most actively traded pairs in the world, and is also known as the cable. When trading GBP/USD, traders use a variety of charting tools and resources including simple moving averages, exponential moving averages, and Bollinger Bands. In the above chart, the simple moving average is indicated by the blue line. The SMA is measured over a period of 50 days, and is currently a smidgen lower (1.301) than the prevailing price of 1.302 (January 14, 2020). The simple moving average (SMA) averages out the closing prices over the last 50 days.
The exponential moving average is currently 1.307, and slightly higher than the spot price of the GBP/USD pair. The exponential moving average, or EMA, is more relevant with respect to closing prices. These are lagging indicators, and they present a clear visual of current trends. EMAs are also more weighted towards recent data than older data, and thus more reactive to price changes than simple moving averages. When choosing between the simple moving average and the exponential moving average, many traders prefer EMAs.
Another important tool is Bollinger Bands. These are represented by the green lines on the chart above. The upper Bollinger Band at 1.327 represents the upper range of the GBP/USD pair and the lower band of 1.288 represents the lower range of the GBP/USD pair. In between these two extremes is the median range of 1.308. Note that the current price is less than the median price, and is perfectly positioned between both bands. This indicates that the GBP/USD is neither overbought nor oversold, and is potentially trading at the right price. If the current price a.k.a. the spot price is above the upper band, the pair is overbought, and if it is below the lower band price, it is oversold.
These resources are imperative in any forex trader’s tool kit. Care and attention have to be paid when attributing macroeconomic events to specific outcomes, given that we all perceive things through our own lens, forming a narrative of what markets are ‘supposed’ to do.

